

THE JOURNAL OF RETIREMENT
FALL 2015 Volume 3 Number 2 www.iijor.com
The Reverse Mortgage:
A Strategic Lifetime Income Planning Resource
TOM DAVISON AND KEITH TURNER
THE JOURNAL OF RETIREMENT – Whether or not the United States faces a retirement crisis, there is little doubt that many older Americans are not well prepared financially,1 and many retirees face the prospect of running out of money as they age. The reverse mortgage is a financial instrument that can brighten the financial prospects of older Americans and reduce the chances of an old age spent in financial straits.
Recent research has shown that strategically combining reverse mortgages and investment portfolios can significantly boost sustainable retirement income. Moreover, in the past three years the regulatory frame- work has been revised to encourage further development of the market for these instruments. Practically, the history of making the features of reverse mortgages better known in the financial planning community dates only to 2011 (Kitces [2011a], [2011b], followed by a series of blog posts and conference presentations).
Today, there is an evolving under- standing of reverse mortgages as a valuable financial planning tool. Reverse mortgages are now seen as well suited for retirees—not only homeowners who are underfunded and turn to a reverse mortgage as a last resort, but also those who enter retirement well-funded. An introduction to this new view is provided in a recent book for homeowners and advisors (Giordano [2015]).
This article explains how reverse mortgages work, notes recent changes to their regulatory framework, and reviews the recent research that demonstrates how a reverse mortgage in combination with a conventional asset portfolio can enhance the wellbeing of retirees.2 This article is address mainly to financial planners working with clients with an actual or potential interest in reverse mortgages.
HOW A REVERSE MORTGAGE WORKS
As its name suggests, a reverse mort- gage (RM) is, in a sense, the opposite of a conventional mortgage. Instead of paying interest and principal to the lender, the lender makes payments to the borrower. Reverse mortgage draws may be received in the form of monthly payments, a partial or lump-sum payment either at closing or later in the life of the loan, a credit line that grows over time, or a combination of the three. We use the term Reverse Mortgage Line of Credit (RMLOC) to encompass variable rate loans with these three features.3
Monthly payments are available in two options—tenure and term. Tenure payments are automatically calculate and paid as long as the borrower lives in the house as his or her principal residence. Term payments are available for borrowers who typically want a larger monthly payment for a shorter period ( Johnson and Simkins [2014]).
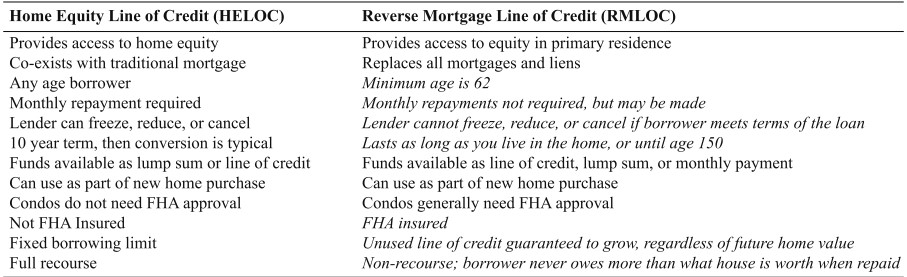
The RMLOC is very flexible. The special features of a reverse mortgage may be better appreciate by com- paring it to a Home Equity Line of Credit (HELOC) in the traditional mortgage world. Exhibit 1 highlights the differences between an RMLOC and an HELOC.
Perhaps the key characteristic distinguishing a reverse mortgage from a conventional mortgage is that a reverse mortgage can be consider as a form of longevity insurance. It can protect borrowers’ access to cash and provides a way for their available funds to grow for increased future borrowing power. In addition, home- owners and their heirs are protect if the debt is greater than the value of the home when the homeowner dies or permanently leaves the house, as long as he or she meets the basic obligations while owning the home.
To qualify for a reverse mortgage:
- The borrower must be 62 or older. A spouse who is not yet 62 when the loan is set up is designate as a non-borrowing spouse and has certain rights when the borrower no longer lives in the home.
- The borrower must meet Federal Housing Administration (FHA) guidelines, including a review of income, willingness and capacity to pay property taxes, homeowner’s insurance, installment debt, and credit cards. This is similar to most mortgage applications.
- If there is a mortgage, the outstanding balance must be paid off, either from the reverse mortgage benefits or the borrower’s other resources.
- Borrowers must complete a one-hour telephone session to obtain a Home Equity Conversion Mortgage (HECM) counseling certificate. This is a consumer protection.
- The home must meet FHA appraisal guidelines.
The percentage of the home’s value that can be bor- rowed is determined by the age of the youngest borrower or the non-borrowing spouse, the current interest rate, and the lender’s margin for a particular loan (Davison [2014b]).4 HECM reverse mortgages are negatively amortizing, and both the principal limit and outstanding balances grow monthly. Homeowners are not require to make payments until they leave the home permanently.
To keep the HECM program on firm financial ground, it is designed so that most borrowers’ loan balances never exceed their home’s value. Younger borrowers’ new loans are a smaller percentage of the home’s value than those of older borrowers, as younger borrowers are more likely to stay in their homes longer. The maximum loan is about 50% of the home’s value when the youngest borrower is 62 years old and increases to 75% for 90-year-old borrowers. Likewise, the maximum initial loan amount is smaller when financial markets expect higher future interest rates, because loan balances are expect to accrue more quickly. FHA regulations limit the applicable home value to $625,500.
Borrowers accrue finance charges only on funds they actually receive.5 The monthly finance charge has three components, two of which are fix: FHA mortgage insurance of 1.25% and the lender’s margin, typically 2.25% to 4.0%. The borrower can select the margin within offered limits, potentially electing for a higher margin to offset closing costs, similar to traditional mortgage lending. The third component is variable and is based on a monthly or annual interest rate, typically the 1-month or 1-year London Interbank Offered Rate (LIBOR). The compounding rate6 for a loan based on 1-year LIBOR in September 2015 might be 5.60%: 1.25% (mortgage insurance) + 3.50% (lender margin) + 0.85% (1-year LIBOR index). During the life of the loan the LIBOR benchmark will reset monthly or annually, changing the compounding rate. The variable component is capped: For a loan based on 1-year LIBOR, the cap is 5 percentage points above the initial rate; for 1-month LIBOR loans, the cap is 10 percentage points above the initial rate.
EXHIBIT 1
Home Equity Line of Credit (HELOC) Compared to Reverse Mortgage Line of Credit (RMLOC)
If there is a line of credit balance available to be borrow, its principal limit grows every month at the same rate as applies to the outstanding balance.7 In the mid-2015 example, the RMLOC principal limit starts growing each month at the annual rate of 5.60%.8 The principal limit, which is the gross loan amount, grows to accommodate potential finance charges regardless of the outstanding loan balance. This key property is a result of being a negatively amortizing loan.
When the last borrower (or non-borrowing spouse) no longer lives in the home (because of his or her death, selling the home, or permanently moving to a rehab/nursing home facility), the reverse mortgage becomes due. Options available include paying off the reverse mortgage including the accrued charges and retaining ownership, selling the home and retaining the difference between the net sale proceeds and the loan balance, or refinancing with a traditional mortgage. The borrower and heirs are not liable for any shortfall if the sale proceeds do not cover the loan. An FHA insurance pool is in place to protect the lender in this situation. All borrowers pay mortgage insurance premiums both as part of their upfront cost and monthly on outstanding balances.9
Two basic questions that need to be answere when choosing among available options on a reverse mortgage loan are, “How much money is need up front?” and “What is the long-term plan?” for the house and the loan proceeds. The pricing process for a loan is fully transparent, as it follows Housing and Urban Development (HUD) guidelines. A variety of generic websites provide loan quotes that may serve as a starting point. Nonetheless, their usefulness may be limit for two reasons: They may not fully present the tradeoffs among choices; and often the costs shown are the highest allow by HUD, as there is no information present about possible lender credits, which can result in over- stating upfront costs by thousands of dollars. All lenders, when asked, will provide scenarios across a wide range of rates. Advisors can help their clients by shopping around for the best rate/closing fee balance for the client and advising on the use of a reverse mortgage.
Extensive Improvements to HECM Reverse Mortgages
HUD/FHA has refined the program over the years to both provide greater consumer safeguards and to protect the mortgage insurance fund. Easy credit during the housing bubble affected the reverse mortgage business just as it did the traditional mortgage business. Unfortunately, some borrowers were able to strip out their equity without demonstrating that they had the inclination or means to meet their ensuing homeowner obligations. This resulted in technical foreclosures and jeopardized the HECM insurance fund. Since the 2008 housing crisis HUD has reform the program in significant ways, affecting the cost, amount of money available, and protections for spouses under age 62 who would otherwise be too young to be list as borrowers. In 2015 HUD materially changed who is eligible for an HECM.
The requirements to keep a reverse mortgage in place are fairly basic. The house must be the homeowner’s primary residence; homeowners must keep current on their real estate tax, homeowner’s insurance, and homeowner’s association fees, and do basic maintenance. Failure to meet these fundamental obligations of homeownership can result in foreclosure, just like a traditional mortgage. To protect borrowers who may be poor candidates for a mortgage and to protect the insurance fund, HUD now requires a “Financial Assessment” that examines the homeowner’s ability and willingness to pay real estate tax, homeowner’s insurance, and homeowner’s association fees. If the borrower cannot meet these underwriting guidelines, the lender is require to set aside funds to cover expected expenses for the life of the loan. These set asides result in less discretionary money for the homeowner, but are not part of the loan balance until draws are made to meet the obligations. In some cases, if there is a mortgage to be paid off with the HECM proceeds, the set-aside requirement may be so large that the HECM will not be viable for that client.
PRIMARY ORGANIZATIONS INVOLVED WITH REVERSE MORTGAGES
HUD and the FHA define, regulate, and insure HECM mortgages (see HUD.GOV; HUD Handbook; HUD/FHA HECM Mortgagee Letters). An actuarial review of the HECM insurance fund was done for HUD in 2014 (Integrated Financial Engineering [2014]). As a consumer protection, before homeowners can apply for an HECM they must attend a counseling session and be certified by a HUD-approved counseling agency to insure they understand the reverse mortgage.
FHA-approved lenders originate loans. Once a loan is made, it typically is bundled with many other loans and, perhaps through a Government National Mortgage Association (GNMA)10-approve lender, sold to secondary market investors who are the underlying funders. There may have been an initial servicer with a sub-servicer handling the loan later.11 Investors view these as high-quality investments as they are back by FHA insurance. Borrowers pay an FHA mortgage insurance fee when the loan is originate and pay mortgage insurance monthly on any outstanding loan balance.
KEY REVERSE MORTGAGE FEATURES FOR RETIREES
Three Ways to Access Home Equity as Cash
Reverse mortgages allow homeowners access to the equity in their homes. A line of credit, monthly payments, or a partial or lump sum payment is available at closing or later if a variable rate plan is select, and we refer to all of these as an RMLOC. Variable rate loans limit the total first year withdrawal to 60% of the loan, with the full balance available the beginning of the second year.
Growth of a Reverse Mortgage Line of Credit (RMLOC)
We described the loan’s compounding rate earlier. One-twelfth applies monthly to three key parts of the loan:
- Principal limit: the total amount that can be borrowed, including interest and mortgage insurance
- Outstanding loan balance
- Borrowing power of a line of credit: the untapped amount that can be borrowed now (Borrowing power = principal limit – outstanding loan balance)
If the maximum amount has been borrow the principal limit and the current loan balance are the same and grow together.
The RMLOC principal limit grows monthly, unlike a typical traditional HELOC, where the principal limit is set from the beginning. Homeowners with a $100,000 HELOC are limited to borrowing $100,000 when the loan is take out, and 10 years later they are still limit to borrowing $100,000 unless they have negotiated a new amount. A homeowner whose RMLOC was initially $100,000 could borrow over $160,000 after 10 years if they experienced a 5% compounding rate. Any amount homeowners voluntarily pay on an RMLOC also grows their future borrowing power at the compounding rate. Ten years after paying $1,000 down on an RMLOC balance, a homeowner can draw an additional $1,600, again assuming a 5% compounding rate. The growth of the amount available is effectively a complimentary part (the flip side) of the negative amortization aspect of the reverse mortgage. RMLOC growth is a key feature making a reverse mortgage “a loan designed for retirees.”
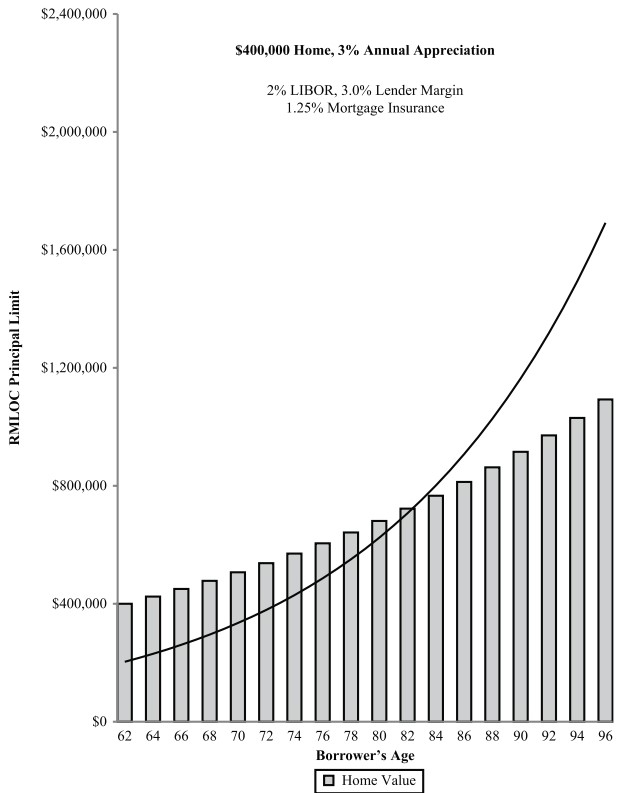
Exhibit 2 shows that as the RMLOC’s borrowing limit increases it can grow to remarkable levels, well more than the home’s value. The upward curving RMLOC shown has a lender margin of 3% and uses 2% as the 1-month LIBOR, which is this loan’s bench- mark rate. The home value is shown growing at 3% a year. With a compounding rate of 6.25% per year, the principal limit would grow from about $200,000 when the borrower was age 62 to $1.7 million when she was 96. The value of her home would have grown from $400,000 to $1.1 million.
An untapped line of credit becomes an increasing supply of tax-free cash that can be used any way the homeowner chooses. Examples include:
- Maintaining an emergency fund for unexpected events later in life, perhaps due to health issues, including long-term care or other emergency among extended family members.
- Supplementing investment portfolio withdrawals to increase lifetime spending.
EXHIBIT 2
Example of Reverse Mortgage Line of Credit Growth Compared to Home Appreciation
- If the RMLOC is larger than the home’s value, withdrawing the cash to boost the estate (net equity in the home becomes zero, but the with- drawn cash becomes an estate asset).
- Providing for alternative housing, (e.g., purchase of a new or second home); pay for home accommodations to retire in place.
EXPANDING REVERSE MORTGAGE USER DEMOGRAPHICS
It is useful to think of reverse mortgages being used differently for three homeowner profiles: those whose retirement plans are well-funded, those whose plans are constrained, and others who are under-funded. Typically, financial planners’ clients are well-funded or constrained. These clients have very different circumstances from the traditional under-funded, perhaps “reverse mortgage as last resort,” homeowners. Each group may best use reverse mortgages in very different ways.
- Well-funded clients have sound retirement plans supporting their expected needs and wants. They may use an RMLOC as a standby or emergency fund, as they may earlier have used a traditional HELOC. Their Monte Carlo success rate12 is high (over 85%), indicating they will rarely face a spending shortfall during retirement. An RMLOC could be an important resource, providing access to a significant amount of cash in their later years.
- Constrained clients typically have Social Security or a pension and a medium-sized investment portfolio. They find their retirement plan to be acceptable, but may have required significant lifestyle tradeoffs. In addition, their Monte Carlo success rates are lower, perhaps 65% to 85%, indicating higher chances they will need to cut future spending because of underperforming financial markets. Their plan may have no cushion to absorb unplanned-for events such as higher medical costs or greater longevity. Constrained clients may especially benefit from using a reverse mortgage in concert with their investment portfolio or other assets.
- Under-funded clients may need cash flow immediately and may obtain a reverse mortgage only after exhausting all their other resources. Their retirement plan Monte Carlo success rates are low (perhaps 60% or less). These clients may have the greatest need for a reverse mortgage. However, it can be demonstrated, using Monte Carlo simulation, that under-funded retirees with home equity that is equal to, or greater than. Their relatively low level of invested assets can gain a tremendous boost from the use of an RMLOC. The challenge may be to maintain a strong financial discipline and to use the reverse mortgage judiciously to their greatest long-term advantage.
HOW REVERSE MORTGAGES CAN INCREASE RETIREES’ FINANCIAL WELLBEING
Retirees want answers to three basic questions about their financial futures: What can I spend? What if I have an emergency like a health-care issue? Can I leave an estate?
“What can I spend?” is typically the top priority and focus of attention, with less concern about emergency funds and estate size. A watershed event in retirement planning was Bill Bengen’s “4% Rule” proposed over 20 years ago (Bengen [1994]). Bengen’s work established an initial 4% of the portfolio as a nominal safe spending rate and 30 years as the standard retirement period. The 4% Rule, however, does not provide guidance for preparing for things going wrong in the long span of life, nor does it directly address estate size.
An important conclusion of this article is that reverse mortgages can help with the retiree’s three basic concerns, enhancing sustainable spending, serving as an emergency fund, and perhaps even boosting estate sizes. Good synergy among a clients’ other assets and reverse mortgages may result in enhancement of each of the three goals.
The published research on using home equity to enhance lifetime consumption is in its infancy, largely dating just to 2012 and primarily encompassed in the small number of studies described here. Sustainable spending rates have been the focus of the research, in line with the client’s first priority. As a result, the extent to which home equity is consume in the effort to increase spending is not consistently address across the studies. Taking cash from a reverse mortgage reduces the equity in the home. However, that does not necessarily result in reduced net worth or estate size. Thoughtful use of cash from a reverse mortgage may sometimes increase the client’s other assets more than enough to offset the reduction in home equity. The result can be higher net worth during life and larger estates, as we will see in some studies. Understanding the client’s priorities and the dynamics among their resources over time is key in selecting a retirement income strategy for them.
REVERSE MORTGAGES: THE 6.0% RULE FOR SUSTAINABLE WITHDRAWALS?
In 2012, financial planning researchers start to address the question of how reverse mortgages could be use to increase spending from investment portfolios. They found that substantial increases in sustainable spending were possible. One author proposed that “Bengen’s 4% Rule” is now “The 6.0 Percent Rule” (Wagner [2013]). Although several studies find that spending can be increase by from 60% to 100%, their results are subject to a number of important conditions, including the relative sizes of the reverse mortgage and the investment portfolio, and assumptions about future interest rates and investment returns.
Using cash from a reverse mortgage to fund spending naturally offsets the need for portfolio withdrawals, in turn increasing portfolio size and sustainability. The key question is then: how big are the spending improvements, and are they “worth it” (as using the reverse mortgage reduces home equity and can reduce estate size)? A further question for a particular homeowner is: what is the best way to blend reverse mortgages and portfolios? Some studies have mention estate impact, often more as a passing comment, and emergency funds during retirement are rarely mentioned.
There are a variety of ways to fund retirement by taking cash from both reverse mortgages and investment portfolios. At least six have been studied, and all methods yielded substantial improvements to lifetime spending. It is no surprise that two sources of cash are better than one. The surprise may be how much better the combinations can be. The six methods are illustrated in Exhibit 3.
The position of the sheet of paper icon indicates whether the loan document is sign early or late in retirement. A large stack of bills shows cash taken as a lump sum and spent soon. The “Loan Early-Use Late” double stack of bills shows the RMLOC money growing substantially before it is used. Individual dollar bills show one year’s spending financed by the reverse mortgage. With a half-circle arrow showing the reverse mortgage being repaid with cash taken from investments.
On the right side of the exhibit, the “+” signs are qualitative indicators of the degree of spending improvement. “Loan Late-Use Late” stands for “Last Resort” homeowners who get a reverse mortgage after exhausting all their savings. It merits a single + as it improves spending by providing more cash but a smaller improvement than the other methods. Which have +++ signs. “Loan Late-Use Late” cannot create synergy between the reverse mortgage and investment portfolio because the portfolio is exhaust before the reverse mortgage starts. It should be noted that a “Loan Late” reverse mortgage can be somewhat larger. As older homeowners receive a larger percentage of the home’s value on a new loan. And any home appreciation helps them. A risk with “Loan Late” is that new loan percentages drop quickly if 10-year LIBOR swap market rates rise. Particularly if taken much earlier. The borrowing power of a loan can grow to dominate the size of a loan taken later. As seen in Exhibit 2.
The other combinations of reverse mortgages and investments all allow synergy—enhanced results due to combining resources. The simple method “Loan Early-Use Early” gets the loan early and immediately funds spending, thus delaying portfolio draws. This allows portfolio growth while both shortening the number of years the portfolio must support. And reducing the sequence of return effects, as at the start of retirement there are no withdrawals finance by depress stocks. Davison [2014a] offers a strategic example of living on the reverse mortgage while delaying both Social Security and portfolio withdrawals.
EXHIBIT 3
When a Loan is Establish and When It Is Use

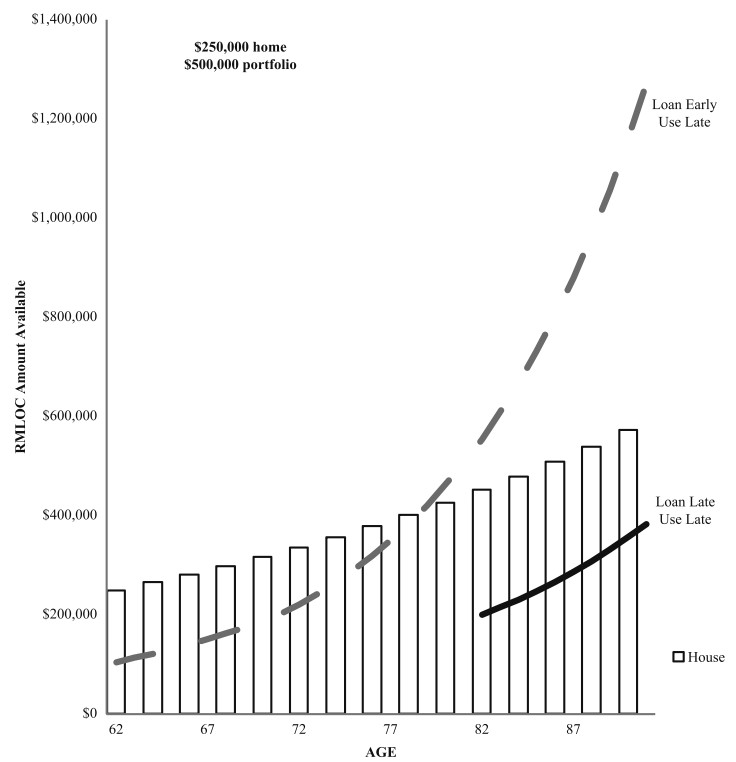
“Loan Early—Use Late” is a very simple strategic use: get the RMLOC early but do not tap it. So borrowing power can grow while living on the investment portfolio, as shown in Exhibit 4. If the investment portfolio is deplet, turn to the RMLOC for cash to live on. “Loan Early—Use Late” gives the RMLOC time to grow during a 30-year retirement. Potentially providing much better lifetime cash flow than getting the reverse mortgage late in “Loan Late—Use Late.” These two methods were studied by Pfeiffer, Schaal, and Salter [2014], with results as shown in Exhibit 4.
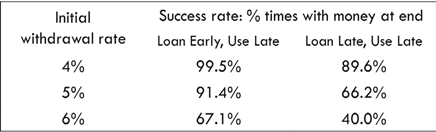
The table shows the homeowner’s chance of not running out of money for initial portfolio withdrawal rates of 4%, 5%, and 6%. With $500,000 portfolios and $250,000 homes appreciating with inflation. Five percent withdrawal rates had a 91.4% Monte Carlo success rate when the RMLOC was establish early and tapped late. Only if the portfolio was exhaust. If the RMLOC was establish only after the portfolio was exhaust as a last resort. It was generally far smaller. (primarily because the rate of appreciation of housing prices was lower than the compounding rate on the RMLOC). And the success rate was only 66%. While not reported, the success rates would have been even lower if no reverse mortgages were available.
EXHIBIT 4
Get Reverse Mortgage LOC Early or Late. Use Late in Retirement If Needed
The “Live on LOC after a portfolio down year” scenario was analyzed by Sacks and Sacks [2012] and Wagner [2013]. “Live on LOC if portfolio is well below plan. Pay LOC back” from the portfolio is the Standby Reverse Mortgage approach we will discuss in detail below.
Wagner’s [2013] study “The 6.0 Percent Rule” directly compared five methods of supplementing portfolio withdrawals with a reverse mortgage.13 The portfolio alone supported a 3.75% sustainable withdrawal rate. The most important overall conclusion is that all five strategies improved sustainable spending rates from 3.75% to 6.0%. 14 a 60% increase. An interesting finding is how similar, rather than how different, the results were. This is a useful result, as individual homeowners could use the method that best fits their circumstances.
Reverse Mortgage Monthly Payment Plans
Fixed monthly payments may be a good fit for many homeowners. They are easy to set up, and reliable cash flow can be comforting to live with. The loan balance builds gradually, and finance charges are base only on payments as they are made. Not on the loan’s principal limit. From an advisor’s perspective. Regular monthly payments do not require constant management and are easy to model in retirement projection software.
Tenure monthly payment plans may be compare to Single Premium Immediate Annuities (SPIAs). Tenure plans have equal monthly payments continuing as long as a borrower remains in the house. The maximum tenure payment is establish by a present value calculation assuming the payment stream lasts until age 100. If the borrower lives in the house past age 100, tenure payments continue. The present value calculation’s discount rate is fix for the life of the loan and is equal to the mortgage insurance charge of 1.25% plus the loan’s expected rate (the lender’s margin plus the 10-year LIBOR swap rate). A term plan is like a tenure plan but uses a shorter period the homeowner selects and payments stop at the end of the period ( Johnson and Simkins [2014]).
Tenure payment plans are more flexible than SPIAs as they can be stop at any time. And any remaining borrowing capacity can be tapp then or later in any way the homeowner chooses. The existing loan balance could be paid down, adding to borrowing capacity. Indeed, if the unused borrowing capacity has grown sufficiently. Stopping and setting up a new monthly payment plan may result in larger monthly payments.
Tomlinson [2015] modeled a homeowner living on an investment portfolio and adding either a tenure plan, an SPIA funded from the portfolio, or both. He compared attainable spending levels and estate sizes. For the same dollar value, the RM Tenure plan yielded somewhat higher initial payout rates than the SPIA (6.70% versus 6.41%). The RM Tenure plan boosted median consumption 18.9%, whereas the SPIA boost was only 3.5% due in large part to the portfolio being smaller after purchasing the SPIA.15 Using the SPIA and RM Tenure plan together increased spending by 22.2%. The general conclusion is that steady monthly cash flow improved portfolio-based spending, and naturally the largest boost came from adding cash flow from home equity instead of using an SPIA carved out from the portfolio. Bequest sizes were noticeably smaller when the RM Tenure plan was involved.
Tomlinson described his study as a launch into research on how to fit RM Tenure plans and SPIAs together. There are important similarities and differences between the two. Both SPIAs and RM monthly income plans have higher payout rates the later they are start. But the method of determining payouts is quite different. RM proceeds are not taxable. Whereas SPIAs may be fully or partially taxable, depending primarily on the source of funds used to purchase them. SPIAs last until death; RM Tenure plans last as long as the borrowers remain in their home. SPIA pricing is sensitive to life expectancy, and differs for males, females, and joint lives. RM Tenure payouts are size to a fix age, ignoring sex and marital status. Which provides a relative advantage for women and couples.
The flexibility of RM plans in allowing a payment plan to be stop while retaining access to untapped capacity may be very valuable given the uncertainties inherent in increasingly long lifespans. Given the differences between SPIAs and tenure plans, perhaps combinations such as starting an RM tenure plan first and later purchasing an SPIA or deferred income annuity would work well, taking advantage of both the tenure plan’s flexibility and an SPIA’s mortality credits when purchased late in life.
Standby Reverse Mortgage: Salter, Evensky, and Others
The method that may have the best combination of improved sustainable withdrawals and borrowing power, and therefore a smaller loan balance at the end, has been called a “Standby Reverse Mortgage,” designed by Salter, Evensky, and Pfeiffer (Salter, Pfeiffer, and Evensky [2012] and Pfeiffer, Salter, and Evensky [2013]).
The authors view the RMLOC primarily as a tool to manage risks to sustainable spending while living on a portfolio. The client gets an RMLOC early and holds it in standby while living on the investment port- folio. After a severe market downturn, the client lives on RMLOC cash instead of investments, reducing portfolio withdrawals near market lows. After the market picks back up, the portfolio again funds spending, and additionally is use to repay the RMLOC. Much of the time. The RMLOC stands ready to be tapped, the borrowing power growing as if it had never been touch. The approach explicitly seeks synergy with the investment portfolio by identifying what appears to be a particularly opportune time to switch spending to the RMLOC and back again. The step of repaying the RMLOC when possible is intend to make the RMLOC available for future use.
Pfeiffer, Salter, and Evensky’s [2013] study is particularly interesting. Keeping in mind the investment portfolio started at $500,000 and plotting the data as sustainable withdrawal rate versus Initial RMLOC balance. Exhibit 5 shows a surprisingly strong linear relationship.
The largest line of credit increased the sustainable withdrawal rate from 3.15% to 6.75%. Or in annual dollars, $15,750 (3.15% of $500,000) to $33,750 (6.75% of $500,000). The sustainable spending rate more than doubled. Another way to characterize the results is an initial RMLOC dollar increase real lifetime spending by a factor of 2.45. The $222,000 LOC allowed $540,000 more real lifetime spending.
EXHIBIT 5
Sustainable Withdrawal Rates for Various Standby Reverse Mortgage Sizes
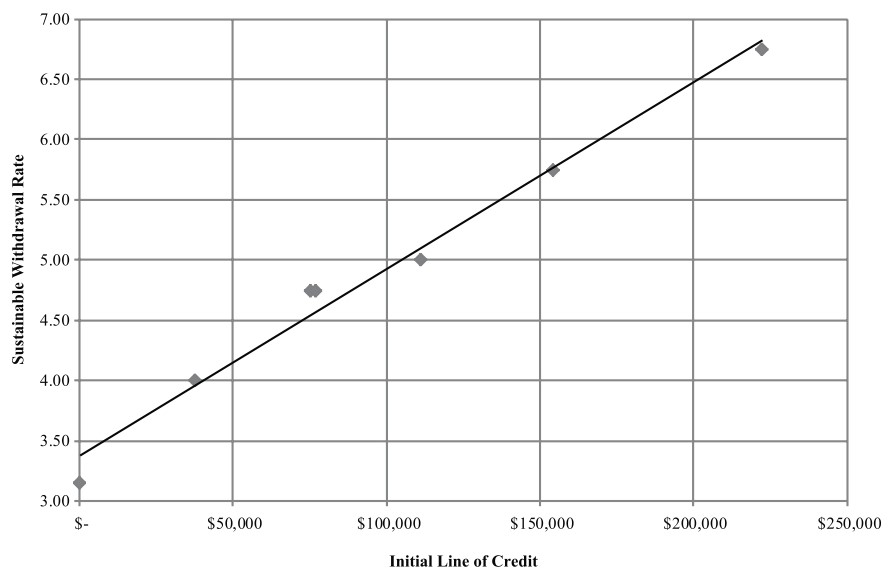
Another noteworthy observation comes from the smallest line of credit of $37,500, or about 7.5% of the $500,000 portfolio. While the impact was the smallest, it was still noticeable. A 62-year-old homeowner with a home worth $625,500 or more could get a reverse mortgage of over $300,000 in today’s market. Scaling the graph’s results up to wealthier clients suggests a $300,000 Standby Line of Credit could substantially increase sustainable withdrawals from even a $4,000,000 portfolio. The strong linear relationship between initial line of credit size and sustainable withdrawal rate shows that line of credit size compare to portfolio size is a key variable.
The Standby Reverse Mortgage was infrequently used but significantly boosted withdrawals in an earlier study by the same team (Salter, Pfeiffer, and Evensky [2012]). Without a reverse mortgage, a $500,000 portfolio could support only a 52% 30-year Monte Carlo success rate. The success rate jumped to 82% with a small ($82,500) Standby Reverse Mortgage. Tapping it only in the very worst markets again proved very valuable. The RMLOC was use, even a little, in less than one in five months. The highest percentage of plans with any loan balance in a year was 25%. The RMLOC was exhauste by only 6% of clients, and many (39%) never use it. The RMLOC was often available, and often completely intact, in later years for purposes beyond boosting annual spending.
Median terminal wealth. Calculated by adding any final portfolio balance to the value of the home and subtracting the loan balance. Was typically somewhat higher with the RMLOC in place. As the authors focused on the RMLOC as a risk management tool for planned spending. They did not count any untapped RMLOC balance in terminal wealth. Even if it happened to grow beyond the home’s value. However, it was often available later in life.
Salter, Pfeiffer, and Evensky’s Standby Reverse Mortgage approach allowed substantial improvement in sustainable spending. We are not aware of any direct comparison of these spending improvements or terminal portfolio size with the other strategies discussed earlier. However, it appears the other methods consumed most if not all of the reverse mortgage as they did not have a strategy to repay the RMLOC. With high Monte Carlo success rates. The stochastic nature of these analyses would have large portfolios at the plan’s end in many projected lifetimes. But the net impact on the reverse mortgage was not consistently address.
Estate size 15 years into the 30-year study period was analyze in the study by Wagner mentioned previously. He pointed out that many people do not remain in their home for 30 years. At 15 years all six of the reverse mortgage strategies increased net worth about 10% to 20%. When using a 60% equity/40% fixed income portfolio. Net worth was measure by the sum of net house value . (the value of the home minus the outstanding balance of the RMLOC) plus the value of the portfolio.
Wagner also presented results from increasing the initial draw from 3.75% to 5.5% instead of 6.0%. The 5.5% withdrawal rate was chose as it would sustainably support a 37-year, rather than 30-year, withdrawal period. After 15 years in retirement with 5.5% initial withdrawals and 70% equity portfolio. The extra portfolio gains would have fully paid off the loan in 77% of lifetimes. And the estate size was 16% to 25% larger for the two best methods of adding reverse mortgage draws to portfolios.
Fundamental Factors in Reverse Mortgage Synergy with Portfolios
Why and how do funds from reverse mortgages improve sustainable portfolio withdrawals? Understanding fundamental factors can guide the best implementation for an individual client situation. The various methods researchers have used to improve sustainable withdrawals take advantage of different blends of several fundamental factors:
- An RM provides more cash for spending, directly adding to spending to reduce portfolio draws or indirectly by replacing other debt such as traditional mortgage payments.
- The RMLOC principal limit grows with time, potentially providing access to more future cash.
- RM funds applied early reduce adverse sequence of returns risk; bad market returns are much more harmful when they occur early rather than late in retirement (Pfau [2013]).
- RM funds applied early delay portfolio draws, giving the portfolio more time to appreciate. Replacing portfolio draws in any year reduces the total years the portfolio supports spending.
- RM funds replacing portfolio draws during major market downturns can significantly increase lifetime spending (Salter, Pfeiffer, and Evensky [2012], and Sacks and Sacks [2012] coordinated strategy).
- RM draws as loan proceeds are tax-free. To spend $1.00 at the 25% tax bracket requires $1.33 from a fully taxable IRA.
REFINANCING TRADITIONAL MORTGAGES WITH REVERSE MORTGAGES
Many homeowners retire with a traditional mortgage still in place. One recent estimate of the average monthly mortgage payment of an American. Between the ages of 65 and 74 years was $617.16 Another reported the median outstanding mortgage balance for 50-year-old to 69-year-old households was $118,000 in 2013.17
There are countless articles and a variety of points of view about the advantages. And disadvantages of having a mortgage in retirement. Replacing a traditional with a reverse mortgage may improve lifetime income for several reasons including:
- The reverse mortgage immediately improves cash flow by eliminating fixed mortgage payments, in turn reducing portfolio withdrawal rates. Reducing withdrawal rates also reduces sequence of return risk.
- Portfolio leverage provided by a traditional mortgage is retain and actually extended by the RM until the house is sold. Leverage from traditional mortgages declines steadily as principal is paid down, while reverse mortgages provide increasing leverage due to negative amortization (Kitces [2013]).
- In addition to retiring traditional mortgage debt, the reverse mortgage may be large enough to provide access to additional cash. Providing further opportunities to boost sustainable withdrawals or net assets.
- Reducing portfolio withdrawals may reduce or delay income taxes attributed to portfolio withdrawals. This advantage may be partially offset by losing a mortgage interest income tax deduction.
Case Study: Replacing a Traditional Mortgage with a Reverse Mortgage
A case study follows an advisor helping a new client, as described in Appendix A. She came to the advisor because her cash flow is too tight. Has Social Security income and an $800,000 IRA. Also has a 30-year life expectancy and just bought a $600,000 house with a $200,000 traditional 30-year mortgage. Planned monthly expenses are $4,650, plus federal and state taxes.
The advisor’s Monte Carlo analysis of her current situation finds a success rate of only 49%. Her IRA is deplete at some point before 30 years have pass in half her simulate lifetimes. The left panel of Exhibit 6 shows her average annual net worth over 30 years. Her home’s net value grows quickly, as the value of her home appreciates and the mortgage is paid down. On average, the IRA grows slowly for a few years but then declines at an accelerating rate, leaving the house as the only asset.
The advisor first recommends trimming spending, but the client rejects the 15% cut required to achieve the targeted 90% success rate. Next, they consider paying off the current mortgage’s $200,000 balance with an IRA withdrawal. Her success rate drops to 33% without even accounting for the taxes due on the withdrawal! The portfolio clearly needs the leverage from the traditional mortgage. The advisor then points out that she is eligible for a reverse mortgage large enough to retire the traditional mortgage and have enough capacity left for either a $137,000 line of credit (Exhibit 6’s middle panel) or $823 monthly tenure payments (right panel).
To get an idea of how the alternatives develop, look first at the overall net worth across Exhibit 6’s three panels. In the early years all three panels have roughly equal net worth, with an edge to the traditional mortgage and investing monthly reverse mortgage payments. In the latter years, the reverse mortgage scenarios outpace the traditional mortgage scenario. Note the IRA size, which grows in the middle panel and grows faster in the right panel. Also note the net home value, which disappears in the right two panels. Finally the other assets: the RM line of credit and a side taxable account. The blend of assets on her net worth statement is quite different in the three scenarios and changes year-by-year.
In the middle panel, the RMLOC is an emergency fund that grows but is never tapped. The Monte Carlo success rate jumps from 49% to 89%. In later plan years, her required minimum distributions force IRA withdrawals larger than needed for her expenses, and the extra cash is invested in a side taxable account. To show the untapped RMLOC capacity without double counting the home, the exhibit’s net home value deducts the actual balance of the reverse mortgage plus the untapped RMLOC, or, said another way, the net home value is (home value—reverse mortgage principal limit).18 The scenario’s 89% success rate means that in 11% of lifetimes the investment portfolios in both the IRA and side account were depleted. As the plan set the RMLOC aside as an emergency fund, it could have been tapped for spending, further improving her success rate.
EXHIBIT 6
Refinancing Traditional Mortgage with Reverse Mortgage
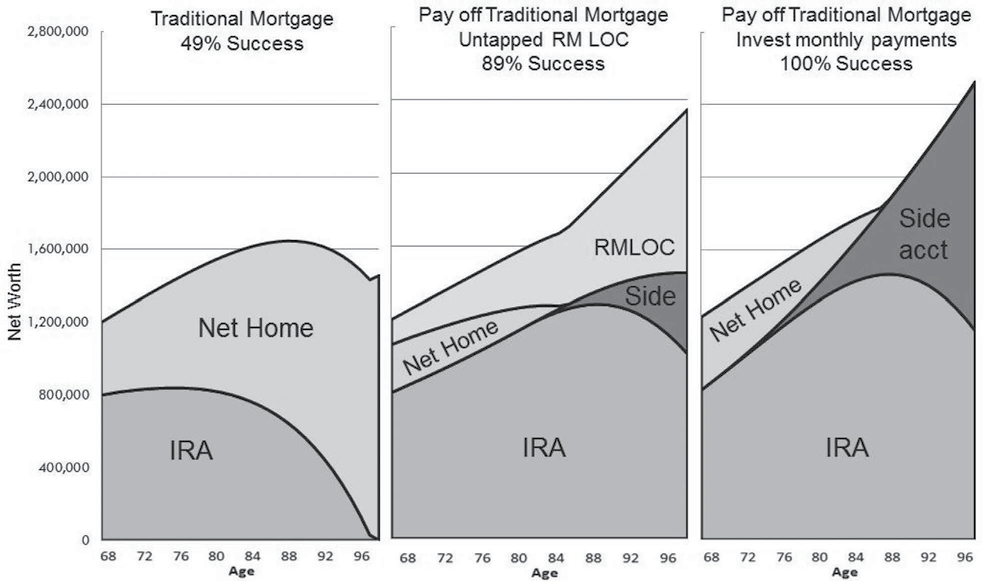
The third panel adds monthly reverse mortgage tenure payments to cash flow instead of holding the unused line of credit. Her Monte Carlo success rate rises to 100% and the taxable side account builds up earlier and relatively quickly. Her spending is fully funded every year of the simulated lifetimes, and there is a cushion for emergencies.
Electing reverse mortgage tenure monthly payments created the highest final net worth, with the untapped RMLOC a close second. Either method provided significant improvements to both her lifetime spending and her estate if she lives into the second half of the plan. The reverse mortgage’s impact stems from a variety of factors, including reducing the client’s initial withdrawal rate from 7.3% to 5.4% by refinancing the traditional mortgage.19
The reverse mortgage eliminated $323,310 of fixed mortgage payments in the 30-year plan (plus extra taxes attributed to withdrawing mortgage and tax payments from the IRA). The reverse mortgage also provided increasing leverage for the portfolio throughout the plan, rather than the decreasing leverage from her traditional amortizing mortgage (Kitces, [2013]). Smaller early withdrawals reduced sequence of return effects. Adding monthly income from the reverse mortgage in the right panel further reduced the withdrawal rate.
This client’s cash flow and net worth in later years were higher with the reverse mortgage than the traditional mortgage. That happened despite the reverse mortgage’s having higher monthly finance charges than her traditional mortgage. Her home equity was consumed by the reverse mortgage, but her investment assets more than offset the home’s value. This example clearly illustrates the need to look beyond the home’s decreased value to the entire balance sheet to under- stand a reverse mortgage’s impact on well-funded or constrained clients with assets beyond their house.
In this case study, once the reverse mortgage is set up, the client can defer the choice between keeping an untapped line of credit and starting monthly payments, and may switch between the two as long as borrowing power is available. In years with excess cash flow from IRA required minimum distributions, another choice is directing cash to either the RMLOC or the side taxable account. Cash additions to the RMLOC will provide a resource that is guaranteed to grow, possibly at a very favorable growth rate.
An interesting alternative to simply refinancing a traditional mortgage with a reverse mortgage and having no payments is for the homeowner to continue to make voluntary payments to the reverse mortgage, perhaps even the same size as before. RMLOC repayments slow the loan balance’s growth and are available to withdraw later after growing at the loan’s compounding rate. As voluntary payments they could be stopped if cash were tight. As discussed below, an RMLOC’s compounding rate can compare very favorably with a taxable investment account.
One concern that may come up in refinancing a traditional mortgage with a reverse mortgage is the loss of the mortgage interest tax deduction. The loss should be evaluated as part of the planning process. The value of a mortgage interest deduction in retirement may be perceived to be larger than it is. The interest on a traditional mortgage drops each year due to amortization. A traditional 30-year mortgage at a 4.25% interest rate pays 50% of the total interest in the first 10 years and 36% in years 11–20, leaving 14% in years 21-30 using nominal, not discounted, values. Some retirees with mortgages may not be able to even use itemized deductions.
A REVERSE MORTGAGE CAN EXCEED THE HOME’S VALUE, ASSURING THE HOME’S VALUE
The homeowner with an HECM reverse mortgage cannot owe more than the home is worth.20 The RMLOC principal limit grows independently of the home’s value as the interest rate benchmark is the only variable in its growth. Over time, the RMLOC may exceed the home’s value by growing more rapidly than the home’s appreciation, as illustrated in Exhibit 2. Pfau [2014] shows there is a good likelihood that RMLOCs of 62-year-olds could exceed their home’s value by their early 80’s.
Once the loan’s borrowing power exceeds the home’s market value, the loan, not the market, effectively sets the home’s value. A homeowner with an untapped RMLOC could realize more value by tapping the line of credit than by selling the house. It is possible that a home’s value may grow only slowly or even decline due to changes in its condition and/or the influence of the housing market in its neighborhood or region. Pfau [2014] notes that “an individual’s home is like a single stock. The price will surely be more volatile than a diversified index of homes.”
REVERSE MORTGAGE SCENARIOS WITH SECOND OR NEW HOMES
Most people think of a reverse mortgage only with respect to their primary home, and that describes the scenarios discussed so far in this document. A reverse mortgage can only be on a principal home, which must be the residence at least six months and a day each year. If a homeowner would like to purchase a vacation home, (s)he could get a reverse mortgage on the principal home and use the cash toward purchasing the second home. A reverse mortgage can also be used to buy a new home that will be the principal residence. The reverse mortgage is typically on the new home.
LIFETIME IMPACT OF REVERSE MORTGAGES ON SPENDING AND NET WORTH/ESTATE SIZE
“But a reverse mortgage will reduce my estate!” Historically, that was true for the prototypical “last resort” reverse mortgage users who turned to their last remaining asset—the equity in their home. They used a reverse mortgage to directly trade home equity for cash flow, ending up with a smaller estate or, after some time, no estate at all.
Naturally, there is tension between spending and net worth. Well-funded and constrained homeowners have other assets with the potential to grow when thoughtfully coordinated with reverse mortgages. The research we have reviewed combining reverse mortgages and portfolios, and refinancing a traditional with a reverse mortgage, shows reverse mortgages have the potential to increase both lifetime cash flow and net worth. The outcomes depend on many factors, including investment portfolio returns and volatility relative to the reverse mortgage’s compounding rates, when the RMLOC is set up, and when and how RMLOC draws and possible repayments are done. Other gains could come from actions such as using an RMLOC in optimizing lifetime Social Security payments by delaying the start of benefits for beneficiaries with long life expectancies.
An intriguing perspective on the holistic approach comes from Tomlinson [2015], following Sun, Triest, and Webb [2006], who say about reverse mortgages: “In effect, we have an asset class with an impressive … spread over the one-month LIBOR swap and backed by a government guarantee.” Very low-cost RMLOCs are currently available for lender margins of 3.5%, providing a spread over one-month LIBOR of 4.75% (3.5% + 1.25% mortgage insurance). With one-month LIBOR currently at historic lows, about 0.2%, that is a 4.95% compounding rate, comparing quite favorably to a much more volatile 30-year Treasury, now about 3.1%.
An RMLOC effectively has two parts: the current loan balance is the “tapped liability” and the remaining borrowing power as “untapped asset.” Both have identical compounding rates with different implications for net worth, as “tapped liability” offsets home value and “untapped asset” vanishes when the homeowner permanently leaves the home. A loan repayment “buys” more “untapped asset” from the “tapped liability.”
With very low volatility and strong returns, the untapped asset share of an RMLOC is an excellent diversifier for both the equity and bond portions allocations in a portfolio. The untapped RMLOC based on 1-year LIBOR might have a long-term annual return even as high as 9%, with a 3.0% or smaller standard deviation, never a down month, very low correlation with home prices (0.03) and stock returns (-0.09), moderate correlation with bond returns (0.33), and high correlation with bond yields (0.85).21 Of course, we need to stress that a positive return of the RMLOC as a standalone asset does require that the principal limit grows to exceed the value of the home.
Imagine a retirement projection with an initial portfolio amount, home, and mortgage. Add an RMLOC as a “non-traditional” asset. This leads to an expanded and more holistic view of asset allocation in retirement with primary asset classes of equities, bonds, homes, and RMLOC loan balance, along with SPIAs and reverse mortgage tenure payment plans.
Thinking of reverse mortgages more like an asset class may be the next step in the evolving understanding of their use in retirement income planning. How much would be allocated to each? What is the rebalancing strategy? An optimization process could be used to understand choices affecting sustainable spending level and net worth, and offer tuning approaches for homeowner’s leanings toward maximizing lifetime spending or estate size.
Not having developed an optimization process, at the present time we have several observations to guide plan design for an individual homeowner. The following steps should maximize the benefit from reverse mortgages:
- Put an RMLOC in place early to allow growth.
- Use an RMLOC gradually with portfolios in order to provide large benefits: e.g., RM monthly payments made throughout the retirement period. In general many of the larger RM benefits develop through compounding the untapped reverse mortgage and/or investment portfolio over time. Gradual use slows loan balance buildup.
- Use RMLOC later or opportunistically to allow maximum growth of borrowing power. This is particularly appropriate for well-funded clients and/or those with small or no traditional mortgage.
- Consider refinancing traditional mortgages with a reverse mortgage.
- Use RMLOC to reduce investment portfolio withdrawal rates.
- Use RMLOC tactically when particularly advantageous for another asset: e.g., do not sell equities when they are particularly depressed (e.g., Salter, Pfeiffer, and Evensky [2012] used their Standby Reverse Mortgage in a manner similar to asset rebalancing).
- Consider paying down an RMLOC loan balance to build up the untapped balance and its growth potential for later use, and also to moderate loan balance growth. This strategy was used in Salter, Pfeiffer, and Evensky’s Standby Reverse Mortgage.
- Conduct periodic reviews of the RM implementation. Include investment, estate, and income tax planning reviews.
- Compare the compounding rate with investment asset class returns.
Consider whether payments on a loan balance should be started or stopped.
The loan balance to home value: The RMLOC’s net investment characteristics change when the loan balance is larger than the home’s value, as growth of the loan balance no longer reduces home value.
Think about the need to revise RM monthly income plans when there are changes to overall financial condition or life expectancy.
Take account of opportunities to minimize taxes.
- Ensure the judicious and disciplined use of RMLOCs above all. Spendthrifts and RMLOCs are not a good combination. RM monthly income may be one of the better approaches for spendthrifts.
- Practical considerations include informing individuals with the homeowner’s health care and financial powers of attorney of the reverse mortgage and its role for the family.
It is noteworthy that many of these elements are excellent matches with a financial planning relationship, or at a minimum, an organized and disciplined approach over time to a family’s finances.
REVERSE MORTGAGES: HARMFUL, OR A KEY TOOL FOR IMPROVED RETIREMENTS IN AN AGE OF LONGEVITY?
Reverse mortgage lore is that they are expensive and may even be dangerous. Anecdotally, the great majority of traditional borrowers were in our underfunded demographic group, and some certainly were “last resort” borrowers in trying circumstances. Some borrowers suffered in the aftermath of the 2008 housing crisis. Over the years there have been foreclosures and difficulties with loan servicers.
HUD has substantially improved reverse mortgages since 2008, including important improvements in the past three years. Some improvements responded directly to consequences of the stress test posed by the housing crisis. For example, until April 2015 borrowers knew they had an obligation to pay real estate taxes and homeowners insurance, but there was nothing in the loan process to qualify the likelihood of being able to meet those obligations. Now reverse mortgages have qualification steps similar to what traditional mortgages have had for many years.
Building on a more robust product, another key evolution is the financial planning community’s recent research, showing homeowners with well-funded and constrained retirements can benefit from reverse mortgages in novel ways. Adding knowledgeable financial advisors’ assistance in planning how to best fit reverse mortgages into an individual’s financial future will be another important step.
Reverse mortgages are not inherently harmful or dangerous. Outcomes will largely be determined by who is using them and how they are used. Like traditional mortgages, they are financial tools. Credit cards are a good analogy. In most people’s hands credit cards are useful tools, providing great convenience with useful perks. However, credit cards can be implicated in financial troubles, not as much from the tool itself but from misuse or cardholders finding themselves in very difficult situations. Reverse mortgages do present great potential to help many current and future retirees live financially safer and more enjoyable lives. Nonetheless, they are not for everyone.
The past three years have brought both significant product changes and significant research by the financial planning community. While powerful, the story is very new and more subtle than many homeowners will see for themselves until it is much more widely known. An example is how a reverse mortgage can safely contribute to increasing their cash flow over a lifetime. Overall, the major positive surprise is the value reverse mortgages can add to the lives of retirees, both those who already look forward to a satisfying retirement and those who are not as well prepared financially but will make it through. This bodes well for a country with a rapidly expanding and aging retiree population.
APPENDIX A
Case Study: Refinancing a Traditional Mortgage with a Reverse Mortgage


ENDNOTES
1 The authors would like to thank Barry Sacks and Shelley Giordano, and especially Sandy Mackenzie, for their thoughtful assistance.
2 In this article, all references to reverse mortgages refer to FHA’s Home Equity Conversion Mortgage (HECM) as administered by the United States Department of Housing and Urban Development (HUD) and the Federal Housing Administration (FHA). These loans make up nearly all reverse mortgages in the country.
3 Fixed rate HECM reverse mortgages are also available, but only variable rate reverse mortgages are discussed in this article.
4 In reading about reverse mortgages, keep in mind that due to ongoing HECM program changes, loan costs, sizes, and other key conditions (such as spouses who are not borrowers) published before Fall 2014 and even later may be quite different from what is applicable to new loans.
5 If closing costs were financed, they are part of the loan balance and will have ongoing finance charges.
6 For clarity this is not called an interest rate: the LIBOR and lender’s margin are technically interest for income tax purposes, but mortgage insurance premiums are not. We also refer to it as a growth rate or finance charge.
7 In certain cases the line of credit could decline if the loan has processing fees or set-asides for scheduled payments like real estate taxes.
8 Reverse mortgage costs fall into several types. “Out-of-pocket” costs are paid by the borrower and typically include the cost for the HECM counseling certificate and for a portion of the appraisal when applying for a reverse mortgage. Upfront costs for setting the loan up are usually paid by proceeds of the loan at closing and typically include the remainder of the appraisal fee, origination, credit and flood reports, title company services, title insurance, and government recording charges. Upfront costs can be reduced to near zero on certain loans in certain situations in the current market. Lender credits on certain loans make this possible. Many loans are immediately sold, and today’s secondary market is very strong for these FHA-guaranteed loans. A lender credit is more likely for loans with higher lender margins—e.g., 3.5% to 4% margins. The size and availability of credits varies among lenders.
In the first year of a loan, up to 60% of the principal limit is available to be borrowed and an initial mortgage insurance premium of 0.5% of the principal limit is included in the upfront costs. Borrowers with mandatory obligations, such as large mortgages to pay off or new home purchase contracts, may access more than 60% in the first year with a mortgage insurance premium of 2.5% of the principal limit.
9 FHA maintains an insurance fund to protect lenders in the event a borrower defaults or the loan balance exceeds the home’s value at the end of a loan. By protecting lenders, the homeowners will not owe more than their home is worth at the end of the loan.
10 Government National Mortgage Association (GNMA), or Ginnie Mae. A government corporation within HUD, Ginnie Mae’s mission is to expand affordable housing.
The Ginnie Mae guarantee allows mortgage lenders to obtain a better price for their loans in the capital markets. Lenders then can use the proceeds to make new mortgage loans available to consumers.
11 For a discussion of the difference between a servicer and a lender see http://www.consumerfinance.gov/askcfpb/198/whats-the-difference-between-a-mortgage-lender-and-a-servicer.html.
12 A Monte Carlo retirement projection simulates many lifetimes. Using expected investment returns and standard deviations, a randomly generated sequence of annual returns is generated for each lifetime and used to assess if the homeowner would run out of money. The success rate is the percentage of lifetimes they did not run out of money. Throughout this document, the term “success rate” refers to Monte Carlo success rates. Outcomes like net wealth at the end of the plan will have a very large range of values. If a single number describes terminal net wealth it will be a central tendency measure like a median.
13 Wagner used monthly payments in fixed amounts in three ways: tenure payments (as long as the homeowner is in the home: $1,328/month sized to age 100: 444 months), 30 years ($2,187/month for 360 months), or a fixed amount equal to the first year’s spending ($2,583/month for 118 months). Another scenario started by living entirely on RMLOC draws $2,583 first year; $2,647 second, etc., and then living on the portfolio (Loan Early-Use Early). His remaining strategy triggered RMLOC draws based on years with relatively poor investment portfolio performance.
14 For 6.0% initial withdrawals from a 60% equity portfolio, the five strategies had 30-year success rates of 86.9% to 92.2%.
15 Funds to purchase the SPIA were taken from the portfolio, while the RMLOC added a new resource to fund spending.
16 http://www.fool.com/investing/general/2015/03/23/heres-the-average-americans-mortgage-payment-by-ag.aspx as of 4/13/2015.
17 http://www.demandinstitute.org/sites/default/files/blog-uploads/baby-boomers-and-their-homes.pdf.
18 If the reverse mortgage is larger than the home’s value, the home fully satisfies the non-recourse loan, so the net value goes to zero but not below.
19 The annual mortgage payments were $10,777 and triggered $4,209 more income tax, in turn triggering more withdrawals.
20 Assuming they stay current on their financial obligations like real estate tax, homeowner’s insurance and basic maintenance. If the loan balance is greater than the home’s value, the loan may be fully satisfied by transferring the house to the lender using a deed in lieu of foreclosure, or the homeowner or heirs may purchase the home for 95% of its appraised value.
21 Typically loans are available today with margins between 2.25% and 4.0%. A 3.5% lender’s margin loan is used as today at that margin level lender credits may be offered that eliminate upfront costs. FHA Mortgage Insurance is fixed at 1.25%. One-month or 1-year LIBOR have short history but historically are fairly close to T-bills, which are estimated at 4.5% return, following Pfau [2014]. Pfau also provides a forward-looking long term estimate of 3.4% for 1-month LIBOR.
REFERENCES
Bengen, W.P. “Determining Withdrawal Rates Using Historical Data.” Journal of Financial Planning, Vol 7, October 1994, pp. 171-180.
Davison, T. “Reverse Mortgage Funds Social Security Delay.” March 30, 2014a. http://toolsforretirementplanning.com/2014/03/31/ss-delay/.
——. “Reverse Mortgages: How Large Will a Line of Credit Be?” July 19, 2014b. Available at: http://toolsforretirement-planning.com/2014/07/19/how-large-is-a-rm-loc/.
Giordano, S. “What’s the Deal with Reverse Mortgages?” Pennington, NJ: People Tested Books, 2015.
HUD.Gov. “Home Equity Conversion Mortgages for Seniors.” http://portal.hud.gov/hudportal/HUD?src=/program_offices/housing/sfh/hecm/hecmhome.
HUD Handbook. “Home Equity Conversion Mortgages (4235.1).” http://portal.hud.gov/hudportal/HUD?src=/program_offices/administration/hudclips/handbooks/hsgh/4235.1.
HUD/FHA. “HECM Mortgagee Letters.” http://portal.hud.gov/hudportal/HUD?src=/program_offices/housing/sfh/hecm/hecmml.
Integrated Financial Engineering, Inc. “Actuarial Review of the Federal Housing Administration Mutual Mortgage Insurance Fund.” HECM Loans for Fiscal Year 2014. Nov. 17, 2014. http://portal.hud.gov/hudportal/documents/huddoc?id=AR2014MMIHECMRpt.pdf.
Johnson, D.W., and Z.S. Simkins. “Retirement Trends, Current Monetary Policy, and the Reverse Mortgage Market.” Journal of Financial Planning, Vol. 27, No. 3 (2014), pp. 52-59.
Kitces, M. “A Fresh Look At the Reverse Mortgage” The Kitces Report, October (2011a).
——. “Evaluating Reverse Mortgage Strategies” The Kitces Report, November (2011b).
——. “Is a Reverse Mortgage Better Than Keeping a Traditional Amortizing Mortgage in Retirement?” Nerd’s Eye View, September 18, 2013. https://www.kitces.com/blog/is-a-reverse-mortgage-better-than-keeping-a-traditional-amortizing-mortgage-in-retirement/.
Pfau, W. “Lifetime Sequence of Returns Risk.” September 27, 2013. http://retirementresearcher.com/lifetime-sequence-of-returns-risk/.
——. “The Hidden Value of a Reverse Mortgage Standby Line of Credit.” Advisor Perspectives, Inc, December 9, 2014, https://tcbdavison.files.wordpress.com/2015/02/hidden_value_of_reverse_mortgage_standby_lin_of_credit.pdf.
Pfeiffer, S., J. Salter, and H. Evensky. “Increasing the Sustainable Withdrawal Rate Using the Standby Reverse Mortgage.” Journal of Financial Planning, Vol. 26, No. 12 (2013), pp. 55-62.
Pfeiffer, S., C.A. Schaal, and J, Salter. “HECM Reverse Mortgages: Now or Last Resort?” Journal of Financial Planning, Vol. 27, No. 5 (2014), pp. 44-51.
Sacks, B. H., and S.R. Sacks. “Reversing the Conventional Wisdom: Using Home Equity to Supplement Retirement Income.” Journal of Financial Planning, Vol. 25, No. 2 (2012), pp. 43-52.
Salter, J., S. Pfeiffer, and H. Evensky. “Standby Reverse Mortgages: A Risk Management Tool for Retirement Distributions.” Journal of Financial Planning, Vol. 25, No. 8 (2012), pp. 40-48.
Sun, W., R.K. Triest, and A. Webb. “Optimal Retirement Asset Decumulation Strategies: The Impact of Housing Wealth.” Center for Retirement Research at Boston College, CRR WP2006-26, November 2006.
Tomlinson, J. “New Research: Reverse Mortgages, SPIAs and Retirement Income.” Advisor Perspectives, Inc, April 14, 2015, https://tcbdavison.files.wordpress.com/2015/05/tomlinson_20150414-advisors-perspectives.pdf.
Wagner, G.C. “The 6.0 Percent Rule.” Journal of Financial Planning, Vol 26, No. 12 (2013), pp. 46-54.
To order reprints of this article, please contact Dewey Palmieri at dpalmieri@iijournals.com or 212-224-3675.